XRP Market Holds in Bearish Correction Trend Lines – December 12
Currently, the Ripple XRP/USD economic book of records has had it that the crypto market holds in bearish correction trend lines as price trades around $0.82 value-line. The market is rated, trading around a negative 1.54 percent as of writing.
Market Holds in Bearish Correction Trend Lines: XRP Market
Key Levels:
Resistance levels: $1.00, $1.10, $1.20
Support levels: $0.70, $0.60, $0.50
XRP/USD – Daily Chart
The Ripple XRP/USD daily chart showcases that the crypto-economic market holds in bearish correction trend lines, struggling to find support around $0.80 over a couple of sessions. The bearish trend lines drawn to signify $0.70 and the value-line mentioned earlier are currently the significant trading spots to decide the next actual direction of the market. The trading indicators are above the bearish correction trend lines as the 50-day SMA trend line is above the 14-day SMA trend line. The Stochastic Oscillators have clogged around the range of 55. That indicates that the movement to the north side faces an impediment currently.
Has the Ripple XRP/USD price mustered enough energy to surge higher above $0.80 as the market holds in bearish correction trend lines?
It appears that the Ripple XRP/USD trade price is still on the threshold of building support baseline around $0.80 and $0.70 as the crypto market holds in bearish correction trend lines. An active pressure to the south side at the higher value-line will see the price going down to the lower point. And, in that procedure, the crypto market long-position takers will have to re-tighten their belts to go for a re-launch of long orders. Investors also may re-consider buying more into the crypto economy.
On the downside of the technical analysis, bearish forces still somewhat have left-over impacts on the market around a higher trading zone at $0.90. In line with the bearish correction continuation, the market will have to push down more from around the upper bearish trend line past the $0.80 for affirmation. Traders should be wary of going short further around a lower trading zone at $0.70 afterward.
.
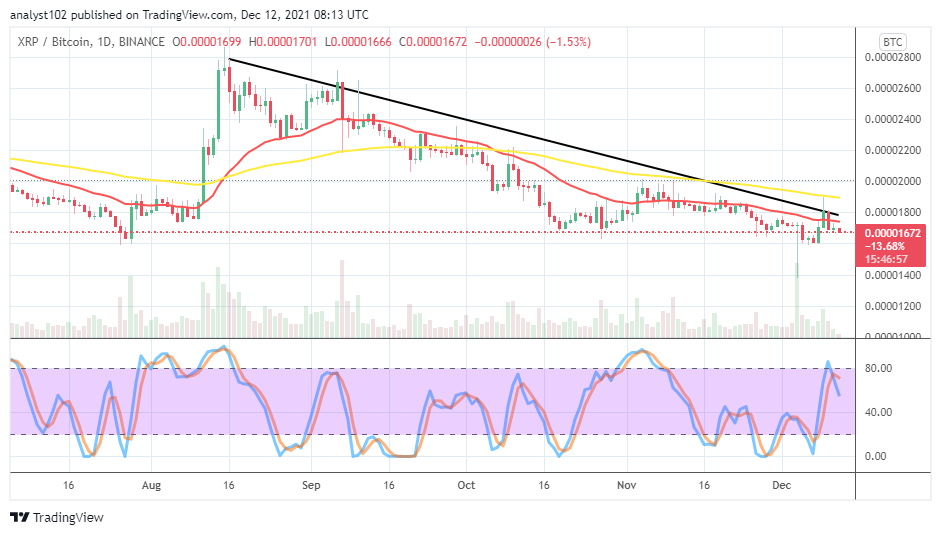
XRP/BTC Price Analysis
In comparison, Ripple XRP’s trending capability has still been under pressure inflicted on it by Bitcoin. The cryptocurrency pair market holds in a bearish trending outlook, showcasing under the trend lines of the SMAs. The 14-day SMA indicator is underneath the 50-day SMA indicator. The Stochastic Oscillators have swung northbound, crossing back the lines southbound at the range of 80. That signifies that the base crypto hasn’t been free from not losing out in momentums to its flagship counter crypto.
Looking to buy or trade Bitcoin (BTC) now? Invest at eToro!

68% of retail investor accounts lose money when trading CFDs with this provider.
Read more:
Credit: Source link


 Bitcoin
  Ethereum
  Tether
  Solana
  XRP
XRP  Dogecoin
  USDC
USDC  Cardano
  Lido Staked Ether
  TRON
TRON  Stellar
  Avalanche
  Toncoin
  Shiba Inu
  Wrapped stETH
  Wrapped Bitcoin
  Polkadot
  Chainlink
  Bitcoin Cash
  Sui
Sui  WETH
WETH  Pepe
Pepe  LEO Token
  NEAR Protocol
  Litecoin
  Aptos
Aptos  Uniswap
  Wrapped eETH
  Hedera
  Internet Computer
  Cronos
  USDS
USDS  POL (ex-MATIC)
  Ethereum Classic
  Render
  Bittensor
  Artificial Superintelligence Alliance
  Ethena USDe
  Arbitrum
  Cosmos Hub
  Bonk
Bonk  Filecoin
  WhiteBIT Coin
  Dai
Dai  MANTRA
  dogwifhat
  Celestia