Market Continues Hovering at $4,000 – December 26
There has been some rising and falling in the ETH/USD price, the crypto-economic market continues hovering at $4,000 over a couple of sessions. The market witnesses a higher trading volume of about $4,136 and a lower of around $3,984. Price now trades at about $4,056 at a smaller negative percentage rate of 0.98.
Market Continues Hovering at $4,000: ETH Market
Key Levels:
Resistance levels: $4,250, $4,500, $4,750
Support levels: $3,750, $3,500, $3,250
ETH/USD – Daily Chart
We now have that the ETH/USD daily chart that the crypto-economic market continues hovering at $4,000 trading level within the bearish correction channel trend lines. The 50-day SMA trend line places closely beneath the value line and, the 14-day SMA trend line is nearly placed above them in the bearish correction channels. The Stochastic Oscillators are in the overbought region, attempting to point southbound. That indicates that depression may soon take up the marketplace.
Will the ETH/USD trade still hold further in the bearish channels as the market continues hovering at $4,000?
There has been no strong indication suggesting a difference in the ETH/USD trade holding further in the bearish channels as the market continues, hovering at $4,000. A bullish candlestick would have to emerge against the upper bearish channel trend line to create a new buying wall over the trading level earlier mentioned. However, the strength signal depicted by the reading of the Stochastic Oscillators doesn’t suggest having that assumption materializing in the near time.
On the contrary to the upside technical analysis, an active falling force has to establish around the trend line of the upper bearish channel to give the ETH/USD market sellers the advantage to launch a position. The market level at $4,000 remains the critical trading zone needed to breach downward sustainably to affirm a return of bearish trend afterward. But, in the process of having the price reverse against some resistances in an early situation, the crypto economy will tend to re-keep its trading pattern in the zone of bearish channels.
ETH/BTC Price Analysis
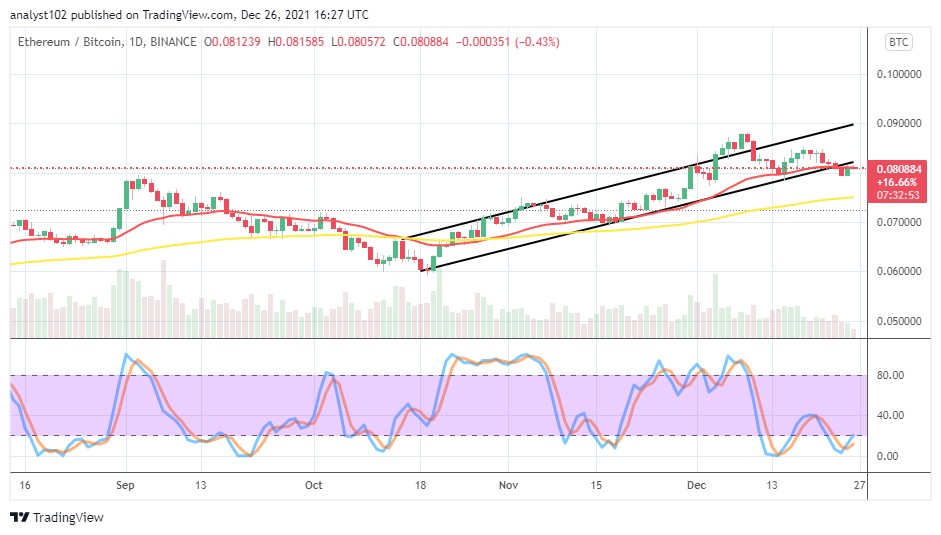
In comparison, the pushing capacity of Ethereum appears yet has a strong stance against Bitcoin. The cryptocurrency pair market continues hovering around higher-lower trading zones. The 14-day SMA indicator is above the 50-day SMA indicator, with a space separating them apart. The Stochastic Oscillators are in the oversold region and, their lines have crossed northbound closer to the range of 20. That signifies that the base crypto has again begun, trying to push against its counter crypto.
Looking to buy or trade Bitcoin (BTC) now? Invest at eToro!

68% of retail investor accounts lose money when trading CFDs with this provider.
Read more:
Credit: Source link


 Bitcoin
  Ethereum
  Tether
  Solana
  XRP
XRP  Dogecoin
  USDC
USDC  Cardano
  Lido Staked Ether
  Avalanche
  TRON
TRON  Toncoin
  Wrapped stETH
  Stellar
  Shiba Inu
  Wrapped Bitcoin
  Polkadot
  Chainlink
  Bitcoin Cash
  WETH
WETH  Sui
Sui  NEAR Protocol
  LEO Token
  Pepe
Pepe  Uniswap
  Litecoin
  Wrapped eETH
  Aptos
Aptos  Internet Computer
  Hedera
  USDS
USDS  Cronos
  POL (ex-MATIC)
  Ethereum Classic
  Bittensor
  Ethena USDe
  Render
  Arbitrum
  Artificial Superintelligence Alliance
  Celestia
  WhiteBIT Coin
  Dai
Dai  Filecoin
  MANTRA
  OKB
OKB  Stacks
  Cosmos Hub